

You can now keep track of Events with our custom-built Power BI template – for customers who use data visualization as part of their business and security strategy.
New in Version 2.0
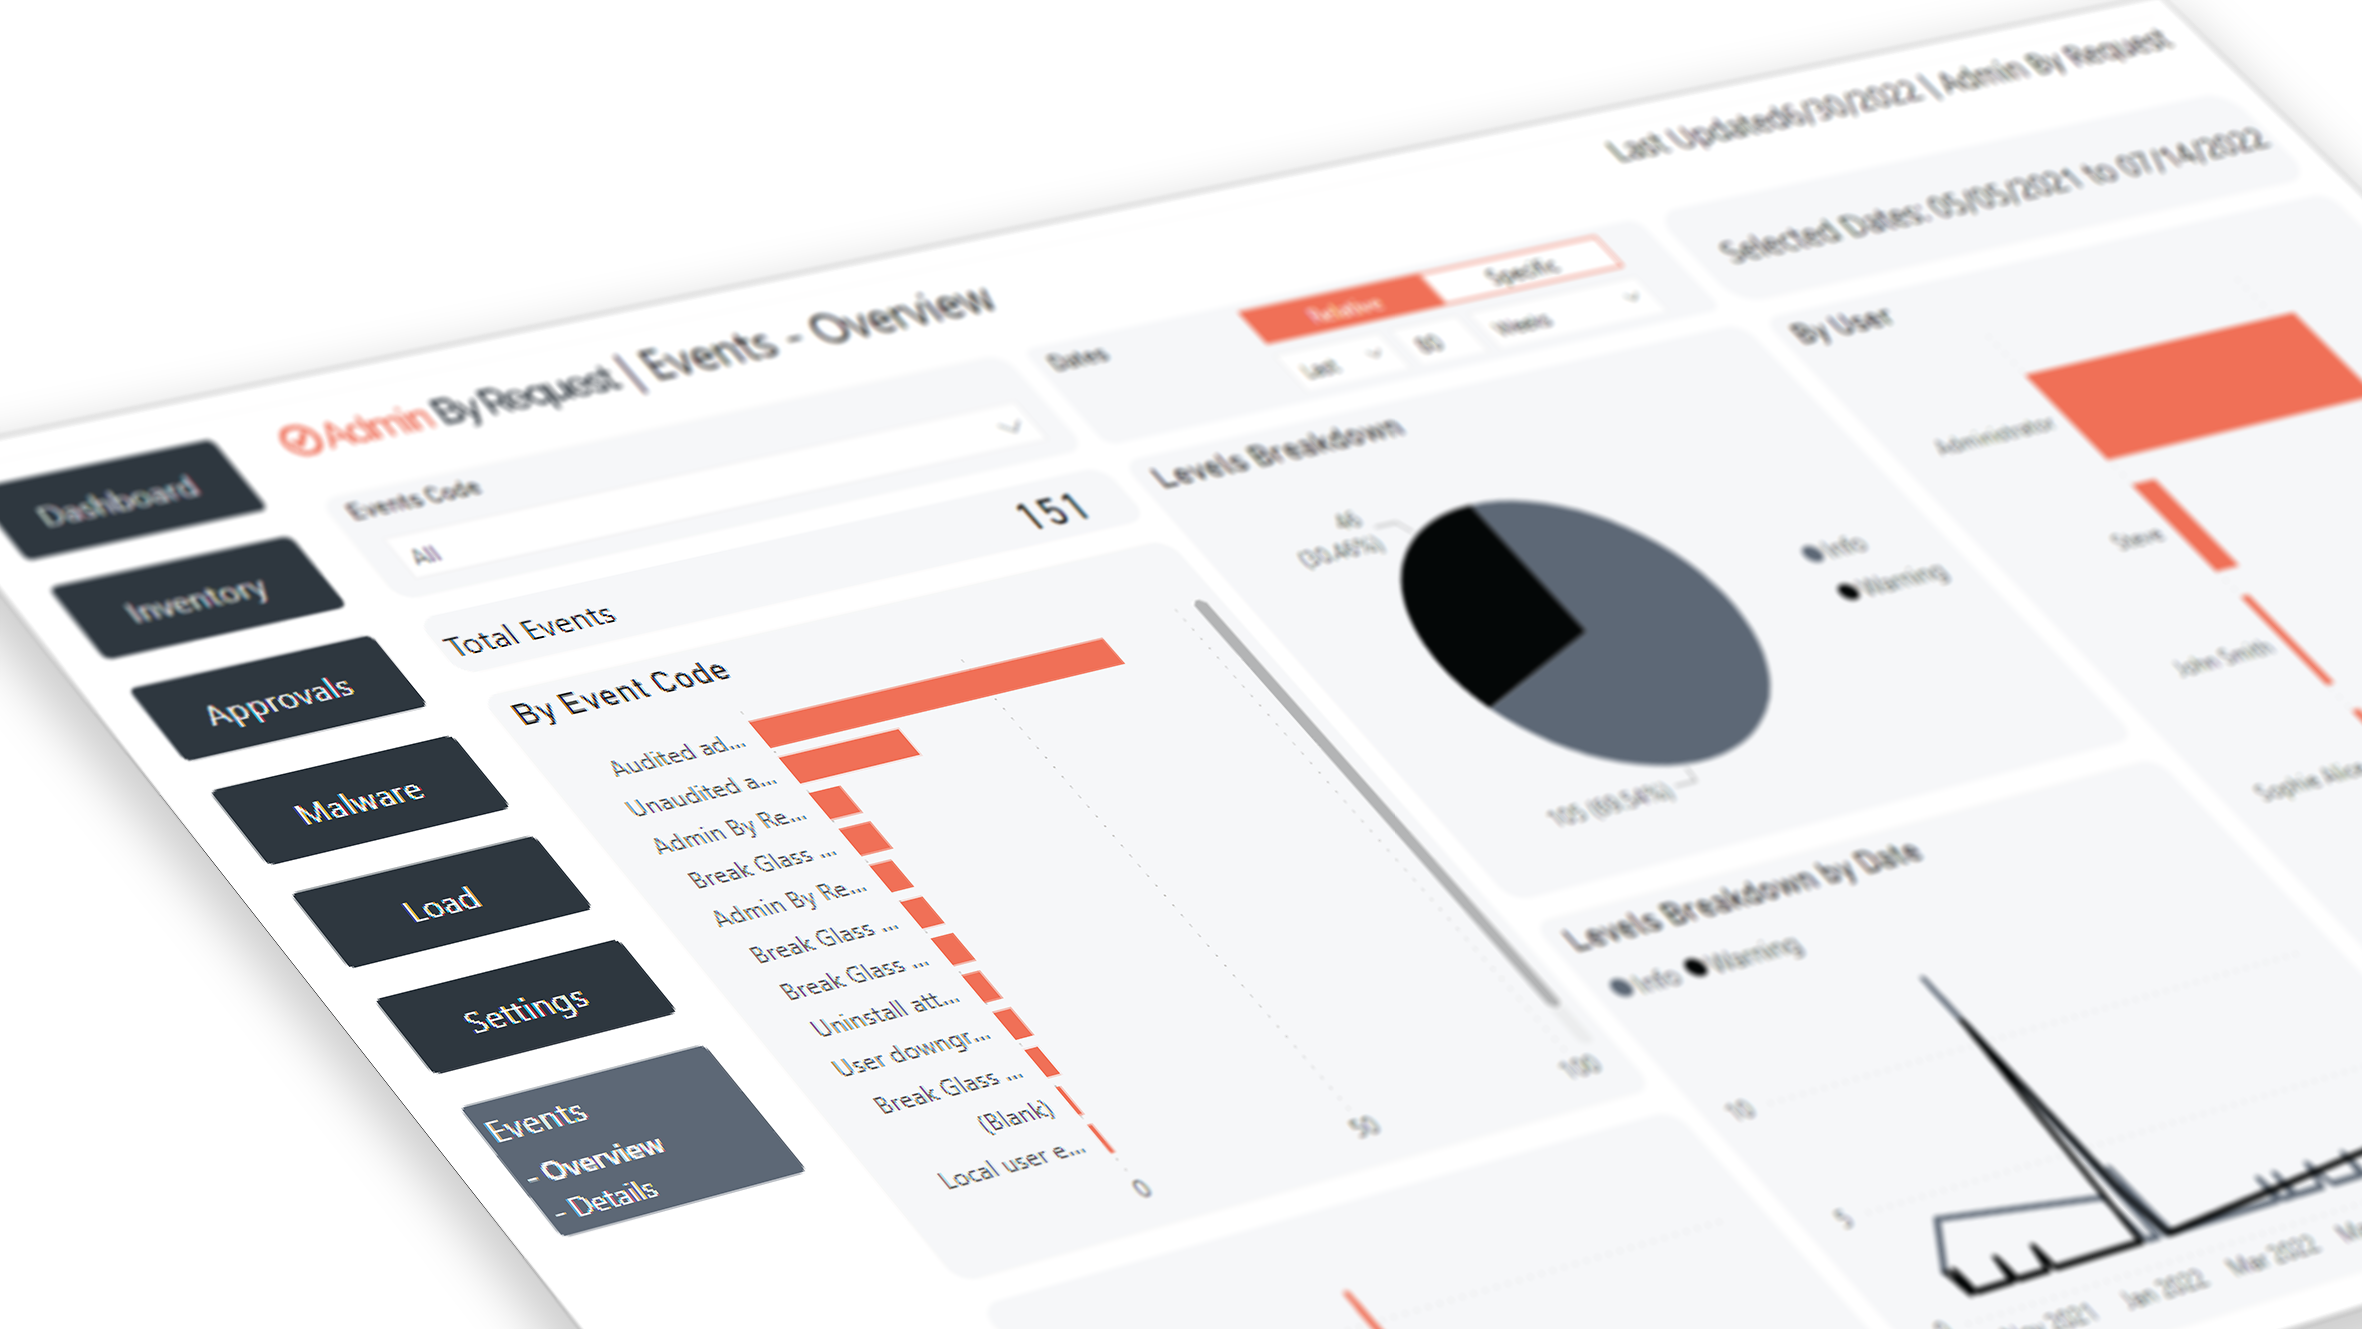
We’ve added an Events page to out Power BI template, so you can view activity such as software updates, tampering attempts and other suspicious activity, and administrative logons in Power BI Desktop or online, instead of having to navigate to the Events page in your User Portal.
Download the template or install the app today.
![]()
Introduction
Interactive, in-depth visualizations, data modelling, business intelligence, and powerful reporting capabilities are all on offer with our latest integration with Microsoft’s Power BI.
As of 2025, it’s predicted that humans will generate 436 exabytes of data per day.
That’s about one billion gigabytes… every day. A lot of that will go unused, but it’s not all useless – data plays a huge role in helping businesses identify strengths and weaknesses, make decisions, develop strategies, find solutions, and generate results.
But in order to be used effectively, data first needs to be made sense of, and that’s where Power BI comes in.
Power BI Overview
Power BI is Microsoft’s data visualization software, which, as the name suggests, is a comprehensive, end-to-end business intelligence tool.
The Benefits:
- Range of Visuals: Including charts, tables, graphs, and maps – all used to transform and model raw data into business insights.
- Interactive Data: Allowing users to drill down and get a fuller understanding of the picture.
- Customizable: Organizations can create their own Dashboard of widgets, tailored to what’s most important to them.
- Interconnected: Visuals can talk to each other – selecting one data point adjusts the data displayed in other visuals.
- Easy to Share: Your custom Dashboard(s) can be generated into reports and sent on a schedule via email to users.
- Integrates Seamlessly: As a Microsoft product, Power BI integrates seamlessly with Excel, Azure, and Access – and now Admin By Request.
The only downside to Power BI is that it can present a bit of a learning curve to get set up – which is why we have taken the hassle out for our customers with our plug-and-play Admin By Request Power BI template, and template app.
What’s On Offer:
The Admin By Request template takes all of your important data and displays it in a range of visuals across the following six pages:
- Dashboard: Here you get a bit of everything – Request info, elevated processes, malware found – it’s an overview of what’s gone on lately in regards to elevated privileges in your organization.
- Inventory: This set of pages cover everything from CPU speeds, free disk space, and memory, to the software version of each application installed on your devices.
- Approvals: Pre Approvals, Admin Approvals, Auto Approvals and Denied Requests are all covered in the Approvals page – as well as a graph detailing the average amount of time it takes for requests to be approved in your organization.
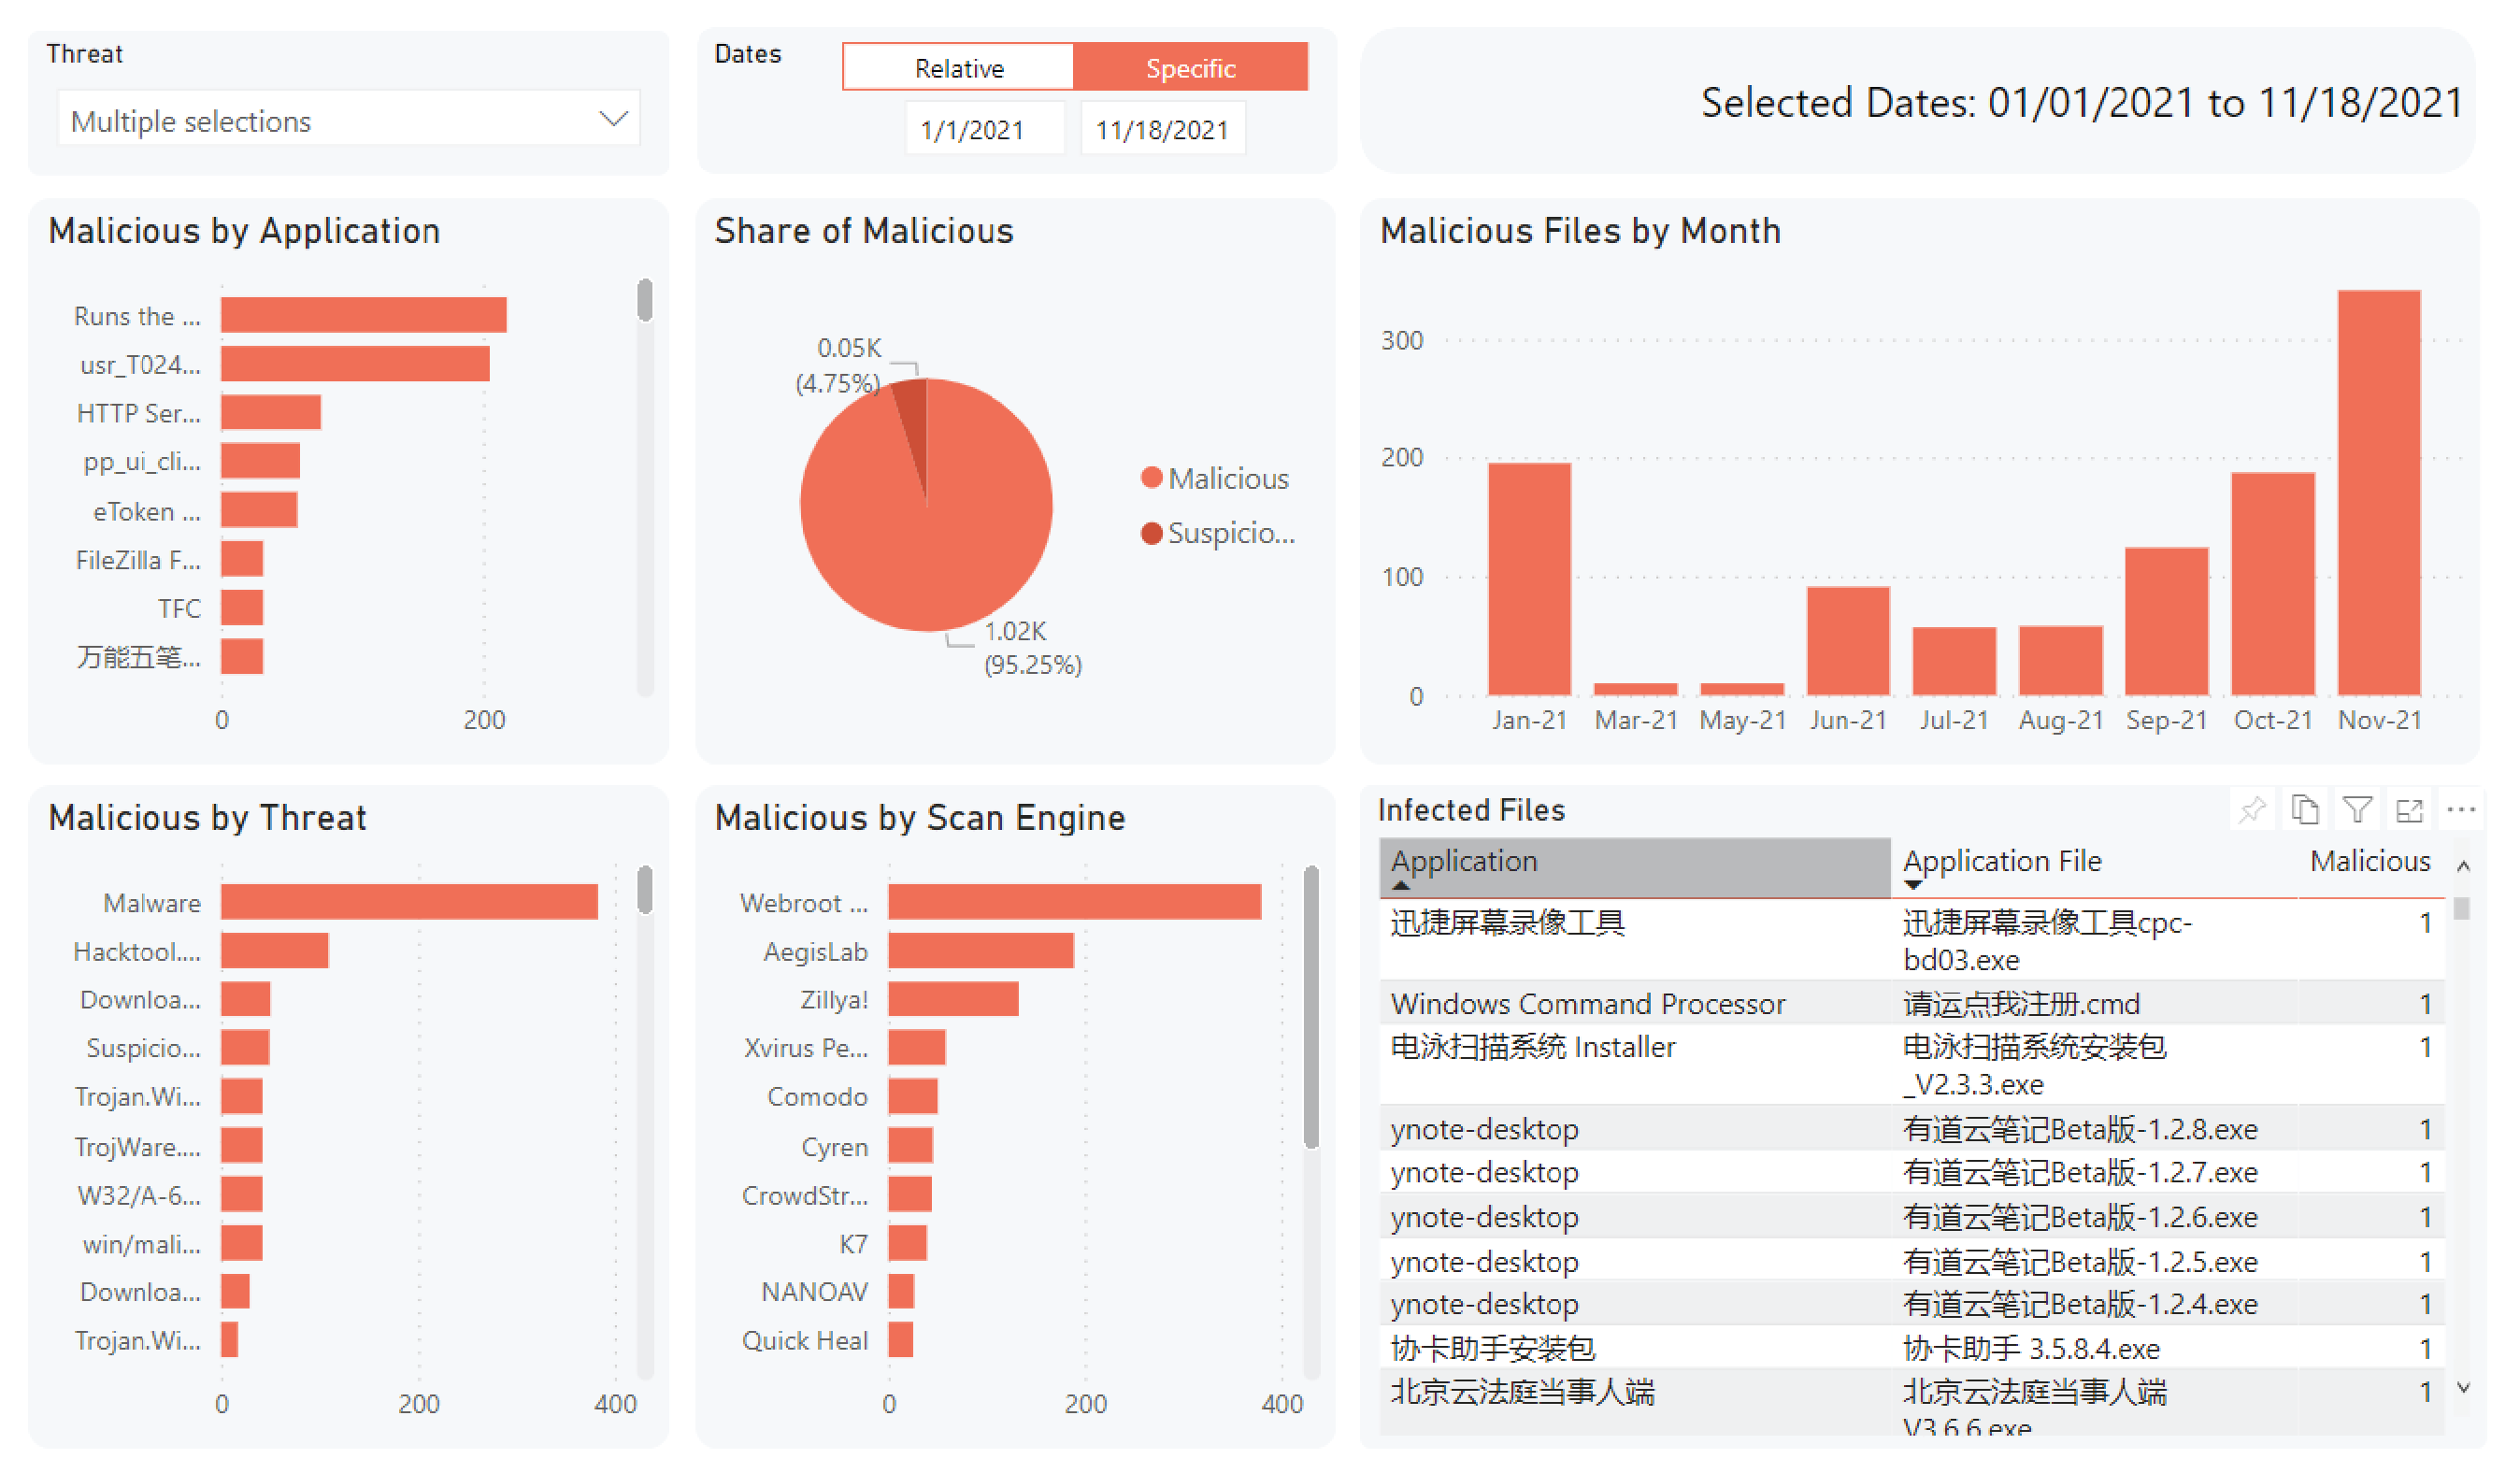
- Malware: The two malware pages provide a map of where malicious files have come from and lists everything from the application filename, to the scan engines that have detected it.
- Load: What day of the week do your users most often require elevated privileges? What time of day are they making the most requests? The Load page answers these questions, and more.
- Settings: This page breaks down settings by user, application, and setting, based on the Sub Settings configured in your Admin By Request User Portal.
- Events: Events such as updating Admin By Request, tampering attempts, and administrative logons are displayed on this page – new in version 2.0.
Other features of the template include result-filters: all data can be filtered based on date, type of request, user, and Sub Settings, with the ability to make multiple selections for each of these filters.
You can also set up your own customized Dashboard of key data and generate regular reports to be sent out to users automatically, from Power Bi.
Feature Video
A demo video showing you how to make the most of this template is coming soon – stay tuned.
Getting Started
If your organization uses Power BI for data visualization, thus Admin By Request / Power BI integration is for you.
Download the configuration manual below to get started.
Something Missing?
If you’ve identified a bug or you’d like some modifications made to our Power BI template / template app, get in touch with Torben Andersen (tan@fasttracksoftware.com) – the developer.
All requests will be taken into consideration.


